DevOps Challenge Part B
In part A of this challenge we deployed a REST API server app which sends a direct message to Rocket.chat triggered by a Gitlab commit event. In part B of this challenge we build on top of this app to provide some monitoring capabilities by exposing and scraping Prometheus metrics.
Code:
The repo for this project can be found here.Deploying Prometheus and Grafana to a Kubernetes Cluster
| Prerequisite | Deliverable | Requirement |
|---|---|---|
| Helm | values.yaml |
Deploy Prometheus and Grafana to your k8s cluster using the kube-prometheus-stack Helm chart |
There are many ways to deploy Prometheus to a Kubernetes cluster but using the kube-prometheus-stack Helm chart as required here is arguably the most straightforward way to accomplish it. The community-maintained chart can be found here.
First let’s add the repo:
helm repo add prometheus-community https://prometheus-community.github.io/helm-charts && helm repo update
Tip
The kube-prometheus-stack helm chart’s values file is quite large at 2000+ lines, and if you’re working in the terminal in Vim like I was you might want to set foldmethod=indentthen use za, zo, and zc to interact with your folds and make it a bit easier to navigate, but firing up VScode is just as easy; whatever floats your boat.
What I recommend for quick edits like this is save the default values.yaml for reference later if needed, make a copy, edit it, then do a vimdiff or colordiff to make sure the changes made are as intended before moving on to the next step.
prometheus-grafana-values-default.yaml:
helm show values prometheus-community/kube-prometheus-stack > prometheus-grafana-values-default.yaml
Make a copy then we will go ahead and make some changes to prometheus-grafana-values.yaml:
cp prometheus-grafana-values.yaml prometheus-grafana-values.yaml
vim prometheus-grafana-values.yaml
One could use ephemeral storage for testing out Prometheus and Grafana quickly but it’s probably not what you want for actual operations. Even though there’s no requirement for persistent storage in the instructions I decided to set it up anyway.
For this particular exercise we will focus on these three things:
- Persist Prometheus
- Persist Grafana
- Add ingress to Grafana
Configure persistent storage for Prometheus in our prometheus-grafana-values.yaml file:
     ## Prometheus StorageSpec for persistent data
     ## ref: https://github.com/prometheus-operator/prometheus-operator/blob/main/Documentation/user-guides/storage.md
     ##
-    storageSpec: {}
+    storageSpec:
     ## Using PersistentVolumeClaim
     ##
-    #  volumeClaimTemplate:
-    #    spec:
-    #      storageClassName: gluster
-    #      accessModes: ["ReadWriteOnce"]
-    #      resources:
-    #        requests:
-    #          storage: 50Gi
+      volumeClaimTemplate:
+        spec:
+          storageClassName: longhorn
+          accessModes: ["ReadWriteOnce"]
+          resources:
+            requests:
+              storage: 50Gi
     #    selector: {}

     ## Using tmpfs volume
and configure persistent storage and ingress for Grafana:
 grafana:
   enabled: true
+  ## Grafana's primary configuration
+  ## NOTE: values in map will be converted to ini format
+  ## ref: http://docs.grafana.org/installation/configuration/
+  grafana.ini:
+    paths:
+      data: /var/lib/grafana/data
+      logs: /var/log/grafana
+      plugins: /var/lib/grafana/plugins
+      provisioning: /etc/grafana/provisioning
+    analytics:
+      check_for_updates: true
+    log:
+      mode: console
+    grafana_net:
+      url: https://grafana.net
+    server:
+      domain: grafana.leokuan.info
+      root_url: "https://grafana.leokuan.info"
+
   namespaceOverride: ""

+    ## Enable persistence using Persistent Volume Claims
+  ## ref: http://kubernetes.io/docs/user-guide/persistent-volumes/
+  ##
+  persistence:
+    type: pvc
+    enabled: true
+    storageClassName: longhorn
+    accessModes:
+      - ReadWriteOnce
+    size: 10Gi
+    # annotations: {}
+    finalizers:
+      - kubernetes.io/pvc-protection
+    # subPath: ""
+    # existingClaim:
@@ -668,25 +707,26 @@
   ingress:
     ## If true, Grafana Ingress will be created
-    enabled: false
+    enabled: true

     ## Annotations for Grafana Ingress
-    annotations: {}
+    annotations:
+      kubernetes.io/ingress.class: nginx
       # kubernetes.io/tls-acme: "true"

     ## Labels to be added to the Ingress
-    labels: {}
+    labels:
+      app: grafana

     ## Hostnames.
     ## Must be provided if Ingress is enable.
     ##
-    # hosts:
-    #   - grafana.domain.com
-    hosts: []
-
+    hosts:
+      - grafana.leokuan.info
+
     ## Path for grafana ingress
     path: /
After configuring the values file, we can finally install the helm chart.
let us first create a new namespace in our k8s cluster called monitoring for all our monitoring resources
kubectl create namespace monitoring
helm install --namespace=monitoring prometheus prometheus-community/kube-prometheus-stack --values prometheus-grafana-values.yaml
devops@k8s-master:~/part-b/prometheus-grafana-values$ helm install --namespace=monitoring prometheus prometheus-community/kube-prometheus-stack --values prometheus-grafana-values.yaml
NAME: prometheus
LAST DEPLOYED: Fri Jun  3 02:20:46 2022
NAMESPACE: monitoring
STATUS: deployed
REVISION: 1
NOTES:
kube-prometheus-stack has been installed. Check its status by running:
kubectl --namespace monitoring get pods -l "release=prometheus"
The following resources will be created
devops@k8s-master:~/part-b/prometheus-grafana-values$ k -n monitoring get all
NAME                                                         READY   STATUS    RESTARTS   AGE
pod/alertmanager-prometheus-kube-prometheus-alertmanager-0   2/2     Running   0          52s
pod/prometheus-grafana-6d6498b446-lcdr9                      3/3     Running   0          60s
pod/prometheus-kube-prometheus-operator-7fc5d45d99-4c7g2     1/1     Running   0          60s
pod/prometheus-kube-state-metrics-94f76f559-wjjdk            1/1     Running   0          60s
pod/prometheus-prometheus-kube-prometheus-prometheus-0       2/2     Running   0          51s
pod/prometheus-prometheus-node-exporter-48864                1/1     Running   0          60s
pod/prometheus-prometheus-node-exporter-cklf9                1/1     Running   0          60s
pod/prometheus-prometheus-node-exporter-p9r6r                1/1     Running   0          60s

NAME                                              TYPE        CLUSTER-IP       EXTERNAL-IP   PORT(S)                      AGE
service/alertmanager-operated                     ClusterIP   None             <none>        9093/TCP,9094/TCP,9094/UDP   52s
service/prometheus-grafana                        ClusterIP   10.99.67.46      <none>        80/TCP                       61s
service/prometheus-kube-prometheus-alertmanager   ClusterIP   10.97.233.56     <none>        9093/TCP                     61s
service/prometheus-kube-prometheus-operator       ClusterIP   10.96.243.205    <none>        443/TCP                      61s
service/prometheus-kube-prometheus-prometheus     ClusterIP   10.110.118.134   <none>        9090/TCP                     61s
service/prometheus-kube-state-metrics             ClusterIP   10.99.11.14      <none>        8080/TCP                     61s
service/prometheus-operated                       ClusterIP   None             <none>        9090/TCP                     51s
service/prometheus-prometheus-node-exporter       ClusterIP   10.99.26.63      <none>        9100/TCP                     61s

NAME                                                 DESIRED   CURRENT   READY   UP-TO-DATE   AVAILABLE   NODE SELECTOR   AGE
daemonset.apps/prometheus-prometheus-node-exporter   3         3         3       3            3           <none>          61s

NAME                                                  READY   UP-TO-DATE   AVAILABLE   AGE
deployment.apps/prometheus-grafana                    1/1     1            1           61s
deployment.apps/prometheus-kube-prometheus-operator   1/1     1            1           61s
deployment.apps/prometheus-kube-state-metrics         1/1     1            1           61s

NAME                                                             DESIRED   CURRENT   READY   AGE
replicaset.apps/prometheus-grafana-6d6498b446                    1         1         1       60s
replicaset.apps/prometheus-kube-prometheus-operator-7fc5d45d99   1         1         1       60s
replicaset.apps/prometheus-kube-state-metrics-94f76f559          1         1         1       60s

NAME                                                                    READY   AGE
statefulset.apps/alertmanager-prometheus-kube-prometheus-alertmanager   1/1     52s
statefulset.apps/prometheus-prometheus-kube-prometheus-prometheus       1/1     51s
For the purpose of this exercise we will edit the service objects prometheus-grafana and prometheus-kube-prometheus-prometheus to use LoadBalancer instead of ClusterIP and set up DNS as well.
devops@k8s-master:~/part-b/prometheus-grafana-values$ k -n monitoring edit svc prometheus-grafana
devops@k8s-master:~/part-b/prometheus-grafana-values$ k -n monitoring edit svc prometheus-kube-prometheus-prometheus

selector:
  app.kubernetes.io/instance: prometheus
  app.kubernetes.io/name: grafana
sessionAffinity: None
type: LoadBalancer
devops@k8s-master:~/part-b/prometheus-grafana-values$ k -n monitoring get svc
NAME                                      TYPE           CLUSTER-IP       EXTERNAL-IP     PORT(S)                      AGE
alertmanager-operated                     ClusterIP      None             <none>          9093/TCP,9094/TCP,9094/UDP   64m
prometheus-grafana                        LoadBalancer   10.99.67.46      192.168.1.223   80:31733/TCP                 64m
prometheus-kube-prometheus-alertmanager   ClusterIP      10.97.233.56     <none>          9093/TCP                     64m
prometheus-kube-prometheus-operator       ClusterIP      10.96.243.205    <none>          443/TCP                      64m
prometheus-kube-prometheus-prometheus     LoadBalancer   10.110.118.134   192.168.1.224   9090:30328/TCP               64m
prometheus-kube-state-metrics             ClusterIP      10.99.11.14      <none>          8080/TCP                     64m
prometheus-operated                       ClusterIP      None             <none>          9090/TCP                     64m
prometheus-prometheus-node-exporter       ClusterIP      10.99.26.63      <none>          9100/TCP                     64m
Optionally configure NodePort to expose your Prometheus and Grafana deployment to access their WebUI from your workstation’s browser if you don’t have a proper domain set up. Also note that if you don’t have valid certificates configured, Kubernetes will reject any client connections on HTTPS and thus Prometheus will show these kube system targets as being down: kube-controller-manager,kube-scheduler,kube-etcd. More on this here.
prometheus-grafana and prometheus-kube-prometheus-prometheus are the service objects you may want to edit to configure that NodePort for the WebUI.
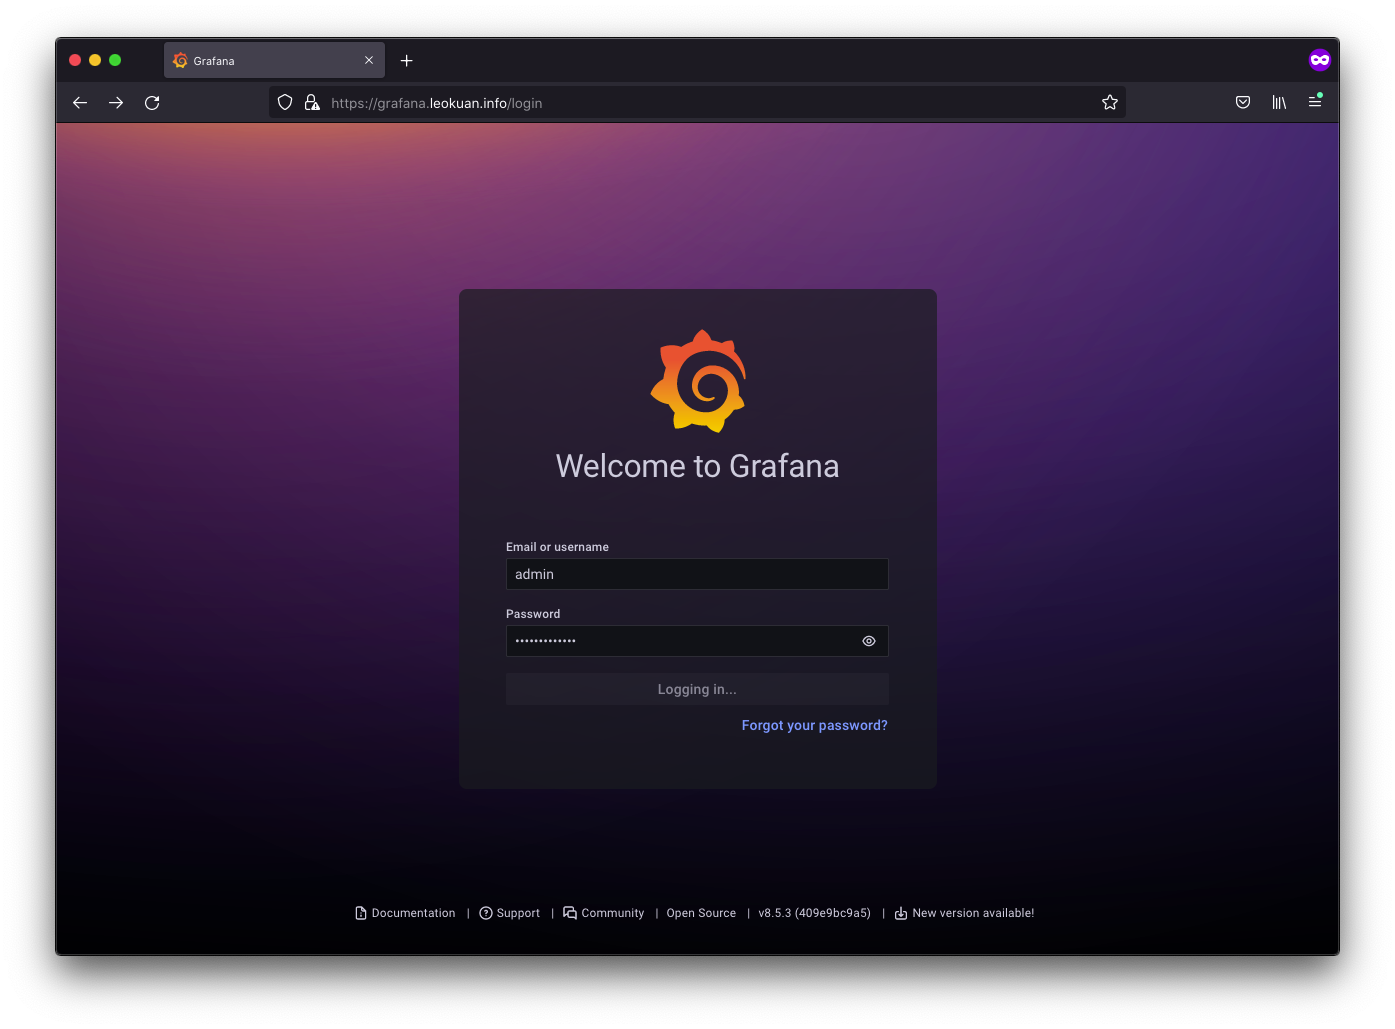
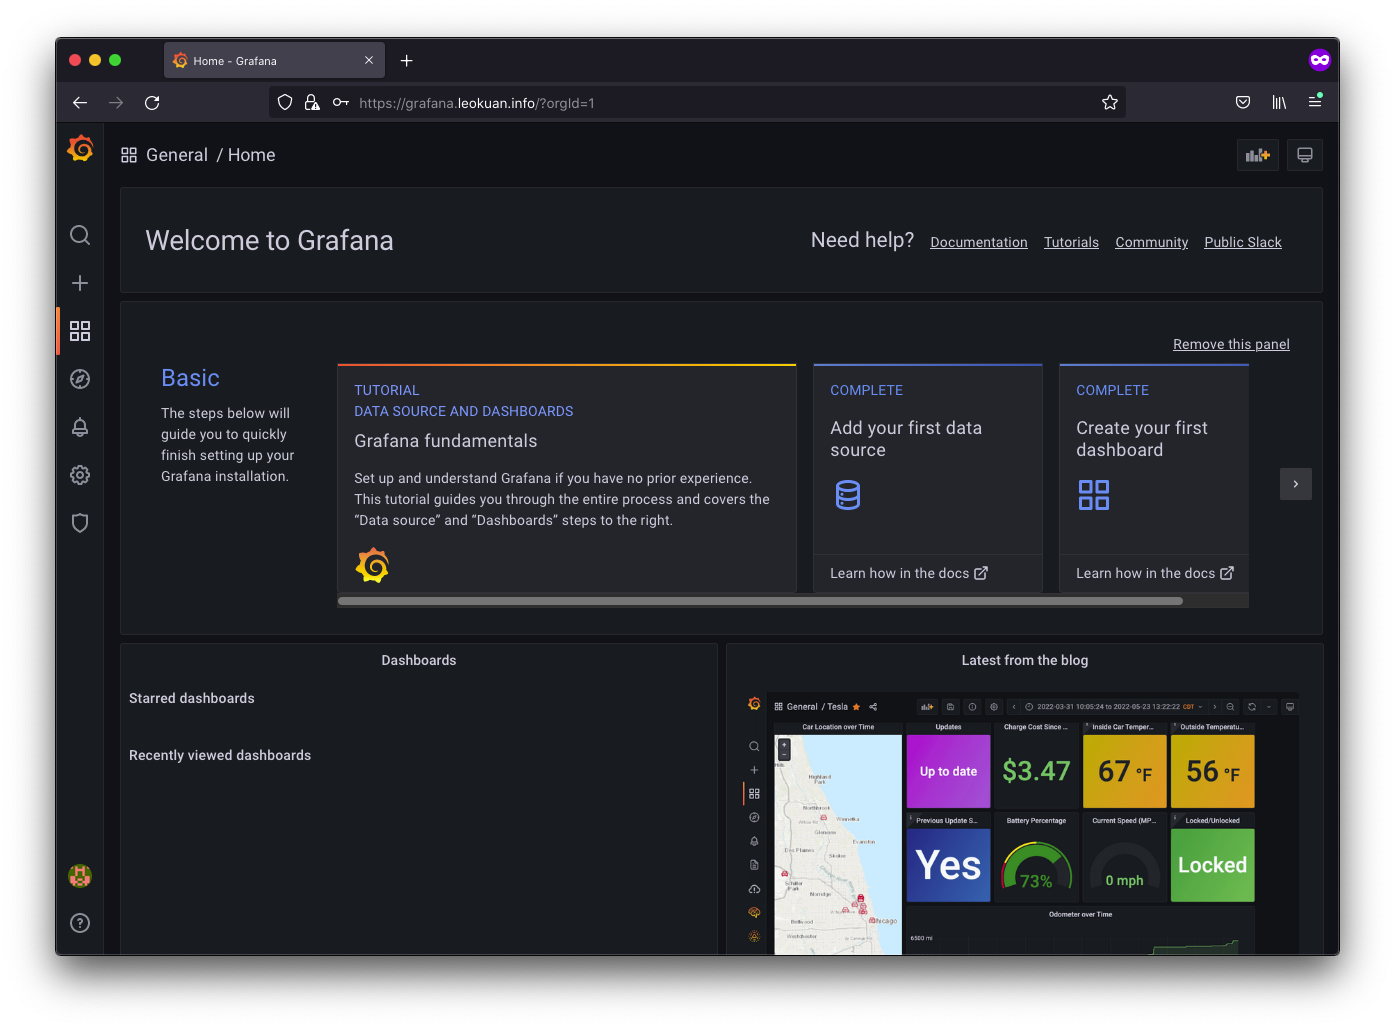
Now go ahead and point your browser to the frontend of your Prometheus and Grafana instance and confirm both are working properly.
The default admin user is admin and the password is prom-operator, which you can also retrieve by issuing the following commands:
kubectl get secret --namespace monitoring prometheus-grafana -o jsonpath="{.data.admin-user}" | base64 --decode ; echo
kubectl get secret --namespace monitoring prometheus-grafana -o jsonpath="{.data.admin-password}" | base64 --decode ; echo
Adding a Prometheus metrics endpoint to webhook-app
Requirement:
Add a Prometheus metrics endpoint to your REST API that exposes a count of received webhooks.For this we are going back to our nodejs webhook app. A quick search of npmjs returned two packages prom-client and express-prom-bundle which uses the former package under the hood. Prom-client looks well documented and simple enough to use for our simple case and seeing as I have no good reason to incur additional dependency I opted for prom-client.
To install prom-client:
npm install prom-client
Obviously the Counter type is what we will utilize to implement the webhook count metric, which only goes up and resets when the process restarts. We add the two mandatory parameters name and help and the counter is incremented when a POST request is made to the “/” route. Note that there’s no reset mechanism implemented for the counter, since there is no requirement for it. Let’s add the following code to the webhook-app.js file:
/* ... */
const http = require('http')
const server = http.createServer(app)
const client = require('prom-client')

let register = new client.Registry()
const webhookCount = new client.Counter({
    name: "webhook_count",
    help: "Number of webhooks received"
})
/* ... */

register.registerMetric(webhookCount)
register.setDefaultLabels({
  app: 'webhook-app'
})

/* ... */
app.post('/', (req, res) => {
    webhookCount.inc(1)
     /* ... */
})
Run it
node webhook-app.js
Let’s test it out locally,
curl -X POST http://localhost:3000
curl http://localhost:3000/metrics
# HELP webhook_count Number of webhooks received
# TYPE webhook_count counter
webhook_count{app="webhook-app"} 2
One easy way to test is poll our metric endpoint using the watch command and have it refresh every 0.1s, note that it’s the minimum number. To generate webhook we can just send POST request to our API server and watch the number increase as
xargs -I % -P 20 curl -X POST http://webhook-app.leokuan.info/ < <(printf '%s\n' {1..50000})
Looks like prom-client works as advertised. Let’s build and test the image locally and push it to dockerhub.
docker build
docker run

Listening at xxxxxxxx
docker push xxxxx
Note: if maybe you’re wondering why I am not using the pipeline built in part A. There’s no requirement for using that in Part B’s instructions and I just felt like making the solution more stand-alone. It’s as simple as committing the webhook-app.js changes to our gitlab instance.
Moving on, there’s no changes to our deployment.yaml and service.yaml on the Kubernetes side of things, since we pushed a new version of the app to Docker hub, let’s rollout the new version. Note that I am using :latest image for the deployment, best practice is to always pin everything to a specific version unless you have a good reason, quick and dirty is my reason and that’s good enough for MVS.
kubectl -n gitlab rollout restart deployment webhook-app
again, we can test the deployement again by curling the NodeIP:NodePort/metrics since we have the deployement exposed on nodeport. here’s the command and here’s the output
Configuring Prometheus to scrape using ServiceMonitor and creating a provisioned Grafana dashboard
Requirement:
Configure Prometheus to scrape that endpoint using ServiceMonitor, and create a provisioned Grafana dashboard for the metric.The main thing about configuring ServiceMonitor is matching the app name and labels in your mainfests
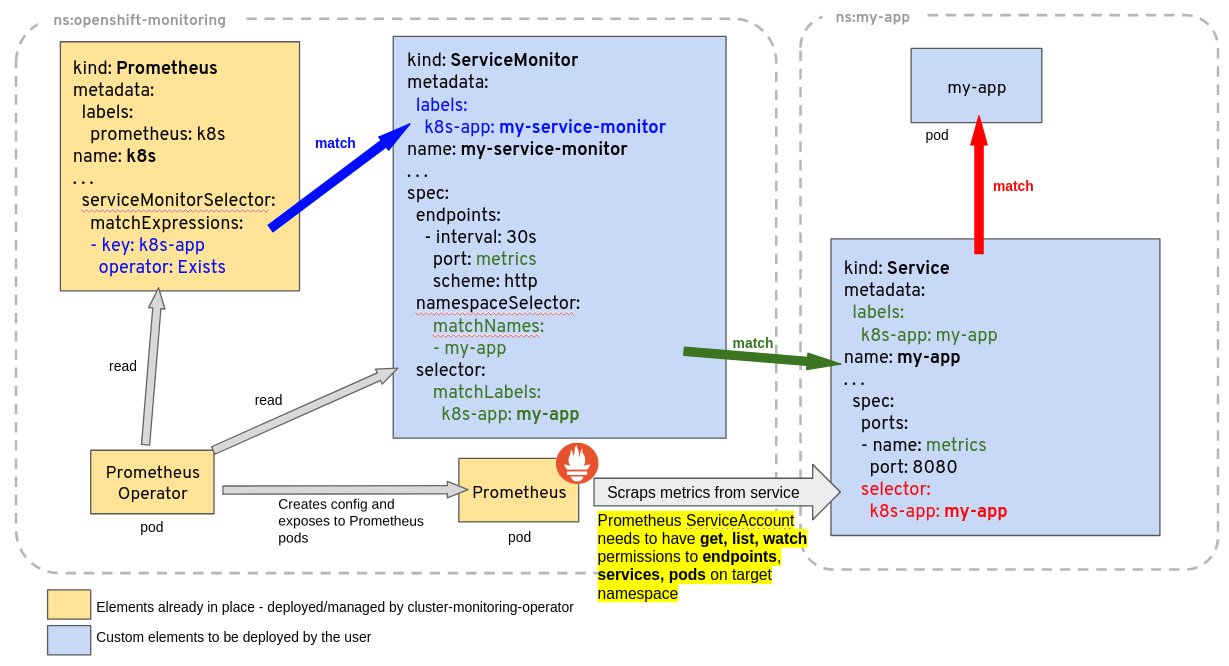
So what we really need to configure Prometheus is the following files:
ServiceMonitor Service
That’s it. and another you want to do is again expose nodeport so we can access it from our workstation outside the cluster.
Next, we will create a provisioned Grafana dashboard, you can clicky click, but another way to do it is by code.
After we created the dashboard using the UI and exported it to json which we will name webhook-app-dashboard.json, we can create the configmap for it.
devops@k8s-master:~/part-b/webhook-app-dashboard$ k -n monitoring create configmap grafana-webhook-app --from-file=webhook-app-dashboard.json --dry-run=client -o yaml > webhook-app-dashboard-configmap.yaml
We also need to add the grafana_dashboard label to it but kubectl doesn’t support the –labels="" flag for create configmap, there’s no clean way to generate the configmap yaml imperatively with a one-liner so we will have to add it in the yaml manually.
labels:
  grafana_dashboard: "1"
Alternatively, we can use another kubectl command to label the configmap
kubectl -n monitoring label cm grafana-webhook-app grafana_dashboard=1
then run
kubectl apply -f webhook-app-dashboard-configmap.yaml
and you will be able to find the webhook-app dashboard in the UI.
Deploying a custom metrics adaptor for Prometheus
Requirement:
Create another custom metric for your REST API that exposes a count of in-flight requests. Deploy a custom metrics adaptor for Prometheus, saving your k8s manifest(s) and/or chartvalues.yaml.
Here’s how I test it. Since there’s no requirement for what kind of traffic we need to generate, one simple way we can test the in-flight counter is by spamming HTTP requests using curl.
xargs -I % -P 20 curl -X POST http://webhook-app.leokuan.info/ < <(printf '%s\n' {1..50000})
You can increase the number of processes to further increase the queue length. This of course depends on your hardware and network spec so adjust as you need, we just need to push the server a little bit to make sure the code works as intended. Since we’re not actually doing anything with each request besides incrementing a counter, it’s very possible that no matter how many times requests you send the server can still keep up because we’re working with a gigabit local network there’s minimal latency. So what do we do? well we can simulate some using the tc command.
Let’s again deploy it following the same step above and try that once it’s running on our cluster.
Adding an HPA manifest to webhook-app
Requirement:
Add an HPA manifest to your REST API that’s sensitive to the custom metric from step 1.Let’s try the traffic again and watch the deployment scale. After ramping up the traffic to trigger scaling in testing, there will be a cooldown period you have to wait a few minutes for it to scale down on its own. If you want to do it manually you have to manually edit the config map to patch to set the replicas to 1.
For whatever reason when I generate traffic on my mac it gets connection refused when I ramp up traffic, and one interesting thing happens when it works. It doesn’t direct traffic to the other newly brought up replicas, the queue length is still long for the origianl while it’s at zero for the other replicas. Generating with another machine running Ubuntu did not cause any issue, weird right?
This behavior raises two good points, one is our scaling strategy, we naively thought that taking the average was a good way, but that also exposes one problem, what if load balancing doesn’t work?
Originally I had thought this had something to do with the default kubernetes load balancing algorithm ,so I looked into and even tried vssd (no keepalive) to see what’s wrong, but didn’t find anything. It was good though because I learned about vssd, and you should look into it too if that’s something that you might find useful.